In the previous articles of the ” Building an offer ” series, we first described how to structure the data forms intended to manage the data to be published ( step 1 ), which led us to describe :
- The definition of the offer forms ;
- The mapping of publications;
- The structure of the graphic charts of the publications;
- What is expected from the offer in terms of automation;
- And therefore what is not automated.
At the end of this first step, we had described the structure of the offer sheets describing our products, our references, our articles, etc., but we were not interested in how to fill them in.
The second article ( step 2 ) addressed this topic:
- Connection to data sources: PIM, DAM, MDM, CMS, ERP, Excel, etc.;
- Initial workflows, updates, links between images and data;
- And how the offer and workflows could drive data production: ordering images, texts, translations, etc.
Starting from the target (web publications, email, RS, catalog, flyer, markup, labels, etc.), we structured one or more templates of cards called “offers”, then linked these cards to the different sources that could inform them, but also engaged manual work to complete them, as well as ordered partners or subcontractors such as photographers, translators, or suppliers to bring the material that will make our offers rich and relevant, as described in the article Different stages of the photo tour . So we have data ready to be published.
We have two more steps to take to publish:
- Set up the “graphic representation”;
- And send these offers to the media.
Setting up the graphical representation
Setting up the graphical representation is based on what we call “modules”, each of which can be seen as a dynamic template.
Basically, each module contains the rules that tell you how to transform the data into a graphic representation:
- The shapes to be generated (InDesign boxes);
- What to put in these boxes (other boxes ? data ? images ? …);
- The styles (as named in the InDesign graphic charter) ;
- Their layout (fixed size, variable size ? under such and such other box ? …);
- Repeaters (list of pictogramms, table headers, …);
- Conditions (do not produce a table if there is only one reference? …);
Note that these rules allow the implementation of “responsive print” modules, which can generate shapes taking into account the surface allocated (to an article, to a product): great flexibility in the composition of pages, and real-time savings for graphic studios!
These modules are managed by the tool called “J2S Module Editor”. To learn more, read the article
Tutorial on automation: making a deck of cards with J2S Module Editor 1/3
which will help you to make your first modules yourself!
As soon as our first modules are set up, each offer presents its rendering, and this is well in advance of the publications, which allows the contributors elaborating the content to see immediately the rendering of their work.
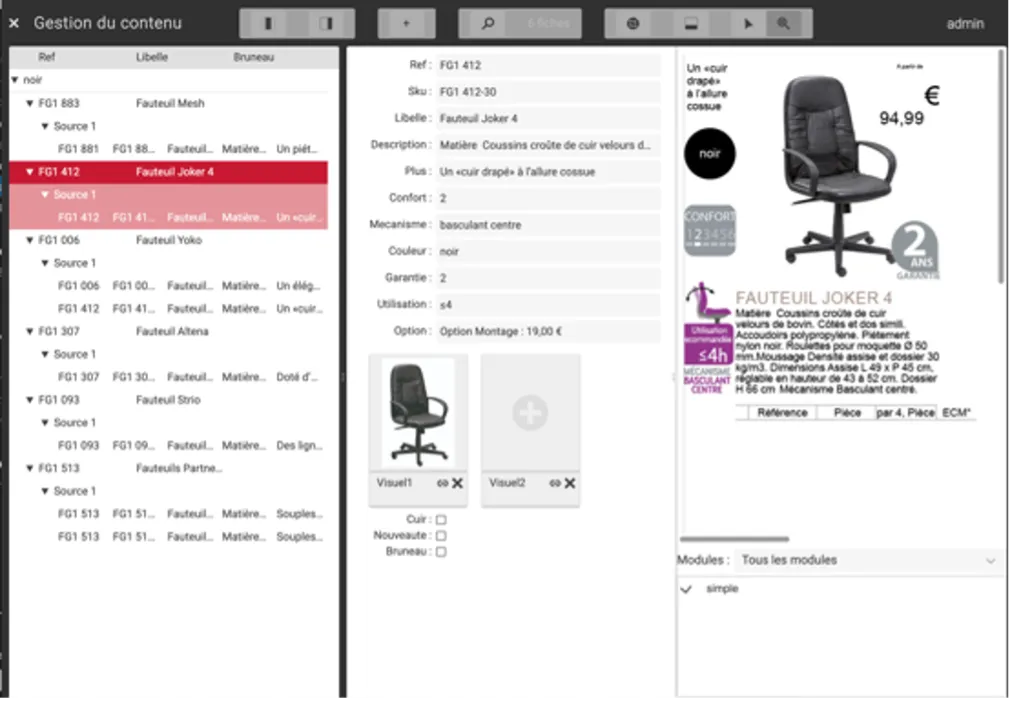
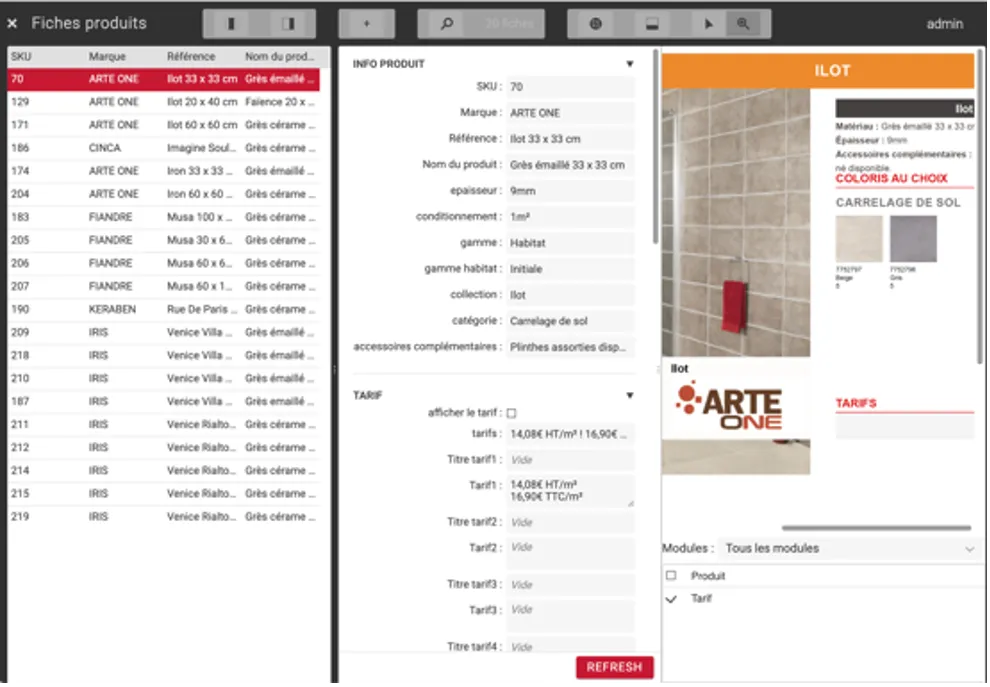
Here is a concrete translation of this with two examples:
- On the left, is the list of offers, here products are broken down into references;
- In the center, the details of the selected offer;
- On the right, is the visual rendering of this offer.
A beautiful mechanism!
We did a first analysis (yes, it’s always a good idea to go through this before doing a job!) to identify what we wanted to publish, and to deduce the structure of the data to be managed to obtain these publications. This general approach allowed us to set up Simple Workspace to describe the structure of our offers: our forms were ready … but still empty!
We then started the second step, which was to identify the means to be used to inform our offers. Depending on the number of offers to publish (10, 100, 10,000, more, much more?), we connected our offers to existing data sources, and identified the data to enter or manage (life cycles, validations, etc.). Simple Workspace made this possible with its multiple sources, Excel imports, connectors and workflows. When needed, our offerings became the “command center” for content aggregation.
For example, an offer can describe an image that is not filled in. This can be left as it is, by letting the users drag it from the DAM.
We can also activate a process starting with a search through the DAM, and in absence of a solution, leading to the order (by email) of the image from a photo studio, which will return its shots in the offer, from which a workflow will ask to select the image(s) used ( or to initiate another shoot), etc. Similar processes exist for text data, for translated data (translation command).
Then, J2S Module Editor enables to describe the rules to transform these data (in connection with the InDesign templates) into a graphic form: layout and styles of texts, images, construction of tables, inserts, reminders, cross-references, etc. From that moment on, each offer sheet showed us the result, allowing the people working on the data to have an immediate overview of their work.
Simple Workspace is a beautiful mechanism, which integrates all the tools that enable to achieve what we have described so far, and much more, as we will see in a future article dedicated to the flatplan.
– – – – – – – – – – – – – – – – – – – – – – – – – – – – – – – – – – – – –
Interested in learning more, or would you like a live demonstration?
Contact us
, we will be pleased to chat.
D. Lantier
Business Developer
